This introductory example compares a sample mean with the same estimate plus
a fixed bias. It produces a figure and report with a useful distinction: the
average error increased, but it did not increase on every seed.
OFFLINE EXAMPLE / RETAINED OUTPUTStoy-v1 · a001
Generated figure and numerical summary
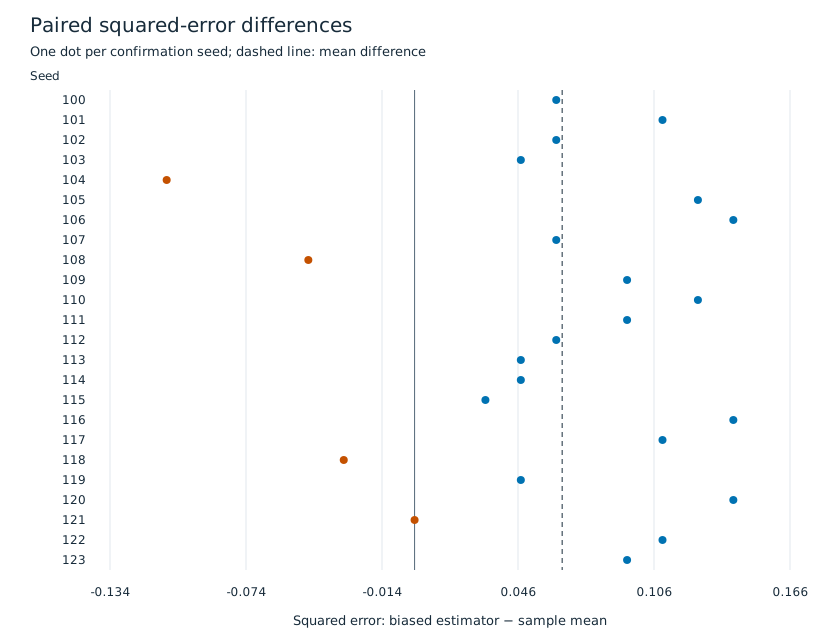
Higher average error, with individual counterexamples
Each point is one of 24 independent confirmation seeds. Positive differences mean the biased estimator had higher squared error. Three differences are negative and one is zero.
We compared the sample mean with the sample mean plus 0.25 for a zero-mean
synthetic distribution. The biased estimator had higher average squared error across 24
confirmation seeds. This is a workflow demonstration with a known analytical
expectation, not a claim of scientific novelty or agent quality.
Results reported in the manuscript
Recomputed quantity
Value
Sample-mean MSE
0.01529948
Biased-estimator MSE
0.08040365
Paired difference
0.06510417
The full manuscript explains the question, mathematical expectation, methods, findings and limitations. Its claim ledger points to the measurements behind each statement.
These selected files are unchanged outputs from the offline toy study,
which supplies its own scientific code. The complete study also retains its
inputs, protocol, raw measurements, failures and retries. No model is involved
in this example.